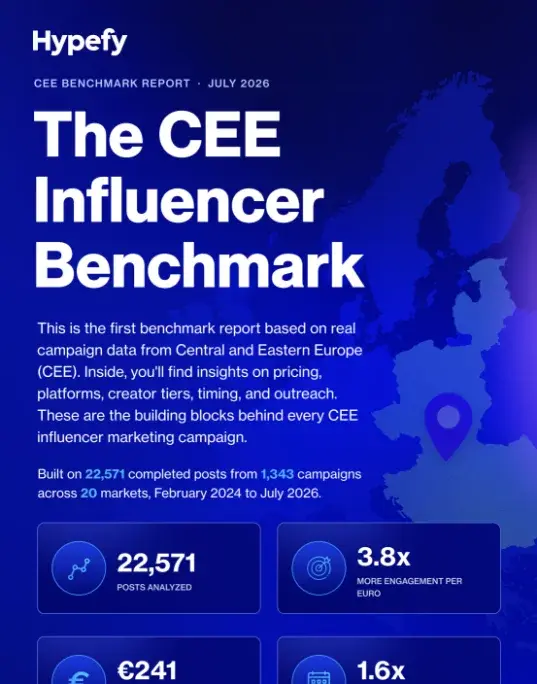
Most brands price CEE off a Western discount.
Most multi-market brands set CEE influencer budgets by knocking a modest discount off Western European figures, and the data shows how expensive that approach can be.
Western benchmark reports cover the US, the UK, and the EU-5. Brands running campaigns in Belgrade, Zagreb, or Budapest plan without reliable data while creators already know the prevailing rates, and that gap decides negotiations before they start.
This report closes that gap with figures drawn entirely from completed campaigns and the prices brands paid in them.
A third kind of benchmark.
Published influencer benchmarks come from surveys that record what marketers say they spend and plan, or modeled rate estimates built from public profile data. Each has real value as context. What they never capture is a price a brand agreed to and paid.
This report is a third kind. It contains negotiated prices brands paid, captured when each campaign completed, with the performance those prices bought. No benchmark of this kind has been published for CEE before.
The same engagement costs €0.34 in CEE and €1.29 in Western Europe.
That 3.8x gap changes how you size a campaign. At Western rates, a €15,000 brief buys roughly 303,000 reach. At CEE rates, the same brief buys around 1.25 million.
Prices also vary widely within the region, with the cost per engagement ranging from €0.31 at the low end to €0.62 at the high end, and even that upper bound falls short of the lowest Western market in the dataset.
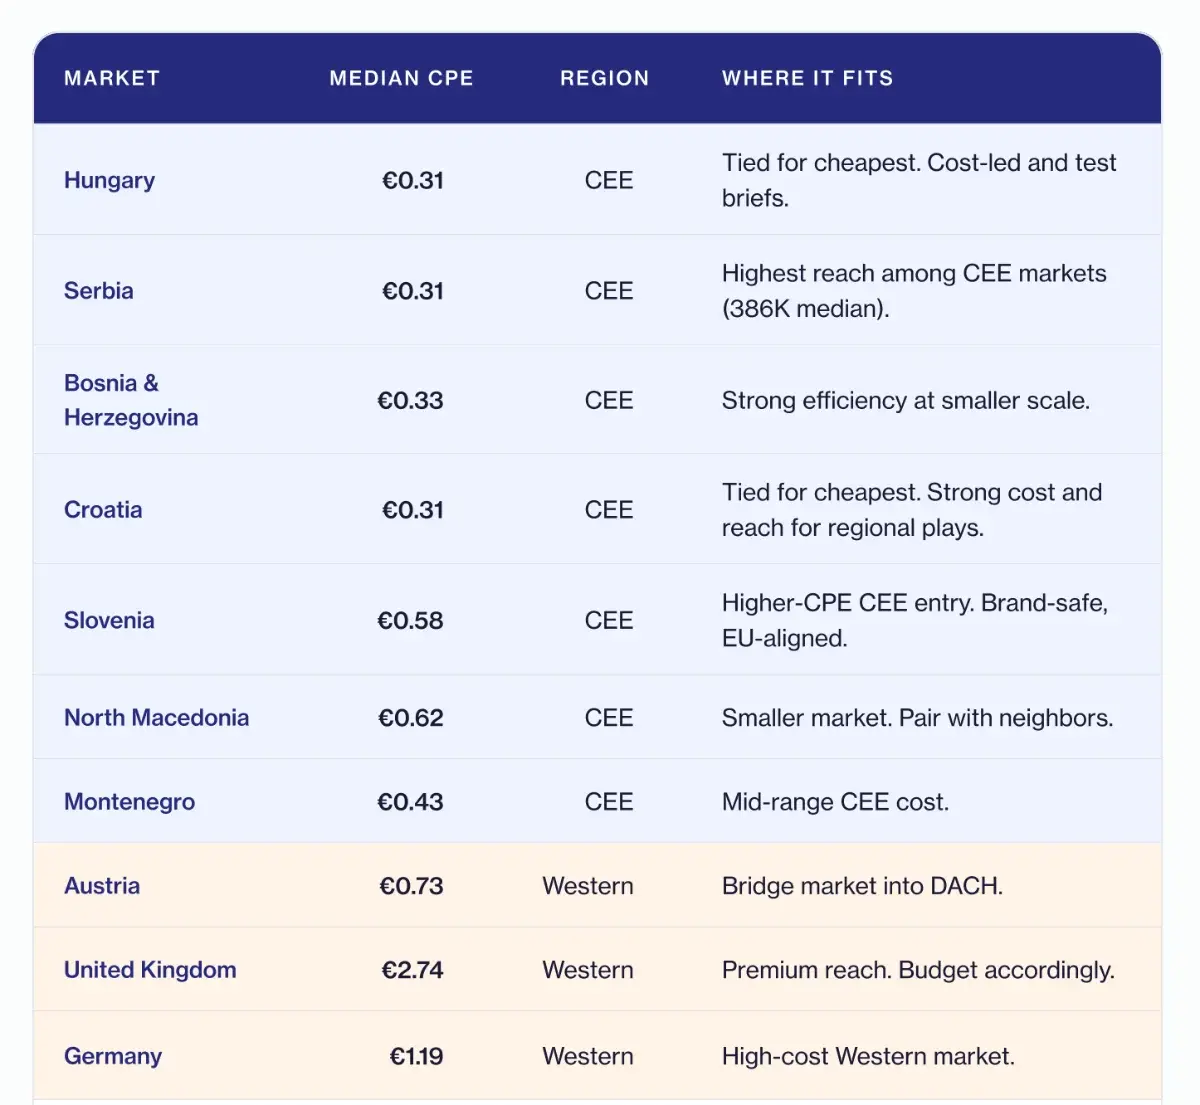
The complete CPE table for the 11 markets with enough campaign volume to price, each with a planning note on where it fits, plus a budget-to-reach ladder that maps €2K, €5K, €10K, and €20K briefs to the creator count, platform mix, and reach each one supports.
Engagement per follower falls from 13.5% at nano to 1.3% at mega.
Follower count is a poor proxy for impact. Engagement per follower falls as accounts grow, and the priciest tiers carry the highest share of doubtful followers.
Mega accounts look cheap at €1.50 per engagement until you see the average post price climb to €940 and roughly 14% of the audience gets flagged as inactive, bot, or fake.
The report also benchmarks every tier against fair value, a modeled price built from follower count, past engagement, market demand, and recent comparable deals.
One tier on one platform currently trades at 3.2x what the model says it's worth (the Instagram peak through the micro and upper tiers). Brands keep paying it because no benchmark existed to challenge it.
The full tier table across both platforms with CPE, average post prices, and doubtful-follower rates, the format ladder from TikTok to Stories, and the fair-value benchmark that tells you which quotes to renegotiate.
The same brief costs 1.6x more in the most expensive month than in the cheapest.
Timing alone increases cost per engagement from €0.30 to €0.48, while holding all other variables constant.
The premium at the year's busiest stretch is real, when retail demand floods the market and rates climb, and the flagships that win that window are booked months before it opens.
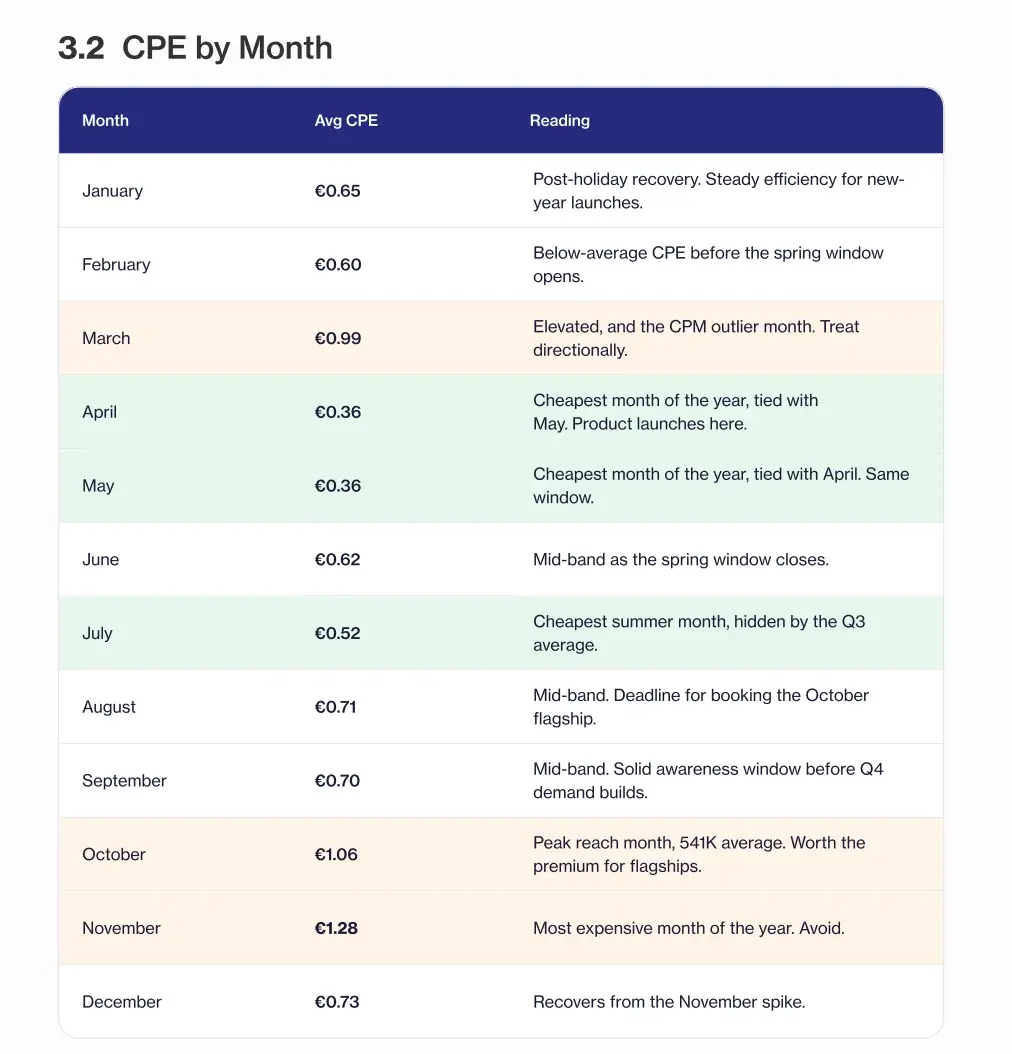
The month-by-month CPE table for the full year, a reading for each month, the launch window worth building your calendar around, and the booking deadline for a Q4 flagship.
Most brands never send the follow-up email that recovers 55% of non-responders.
Across 8,277 influencers contacted in 44 markets, 89% of first emails get opened, 60% of creators reply, and 19% of everyone contacted ends up signing. The biggest leak sits between first contact and signature, and most of it is recoverable.
Response behavior also splits sharply by region.
The best-converting CEE market closes follow-ups at 46% while the UK sits at 74%. An outreach plan built on Western response assumptions will come up roughly half short in CEE.
Follow-up conversion rates by market, the full outreach funnel with stage-by-stage timing, and the planning math for how many creators to contact per signed deal.